Overview (in a nutshell)
The tool allows the user to select between two modes of operation: a beginner mode, and an advanced mode (screenshot 1). The beginner mode (screenshot 2) simplifies the experiment setup process into 5 easy and quick steps: loading the data set (more details in the Detailed Guideline section below), specifying whether and, if so, how many features are to be automatically extracted from the data set, choosing whether to apply feature selection, choosing a preference learning algorithm, and finally running the experiment. The advanced mode (screenshots 3-6) on the other hand involves 5 (more advanced) steps, all but the last of which are encapsulated in their own detailed tab: loading the data set (screenshot 3), data pre-processing (screenshot 4), feature selection (screenshot 5), preference learning (screenshot 6), and running the experiment. In this case, each of the three tabs for steps 2-4 provides a set of options or parameters through which the experiment setup may be fine-tuned by the user. Initially, the interface areas for steps 2-5 are locked in both modes. Once a dataset is correctly loaded, they are enabled and accessible.
In both modes, the interface allows the user to set up the parameters for steps 2-4 in any order and in fact, pre-processing and feature selection are optional. Once all the options are set, the user can run the experiment from the last tab in the advanced mode or from the bottom of the window in the beginner mode.
A progress bar and training report (screenshot 7) will be displayed while the preference learning algorithm runs, and once ready, a report of the experiment and its result is presented (screenshot 8).
Screenshots
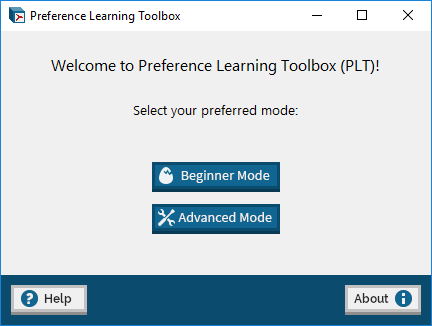
1. Main Menu – allows user to select between a mode of operation (Beginner or Advanced).
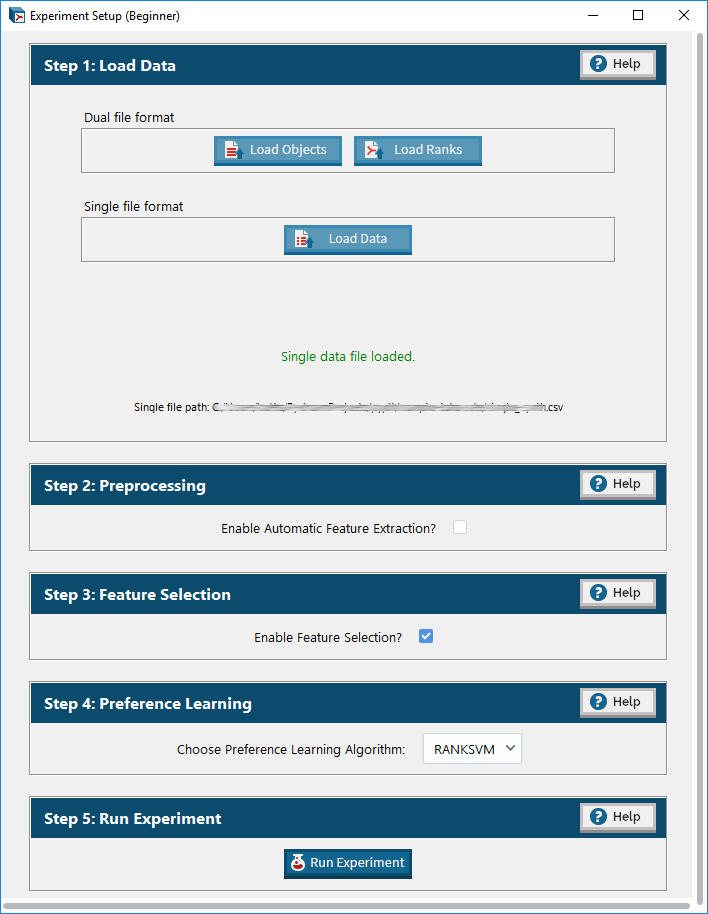
2. Beginner Mode – a simplified menu for setting up an experiment.
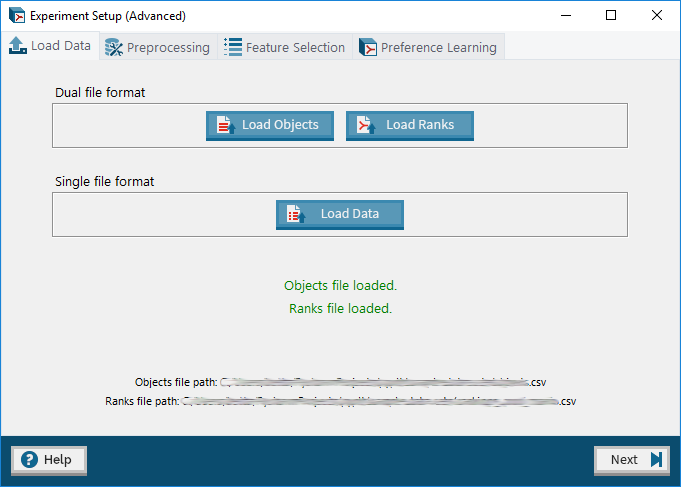
3. Advanced Mode: Load Data tab – allows user to upload a dataset in either the dual or single file format.
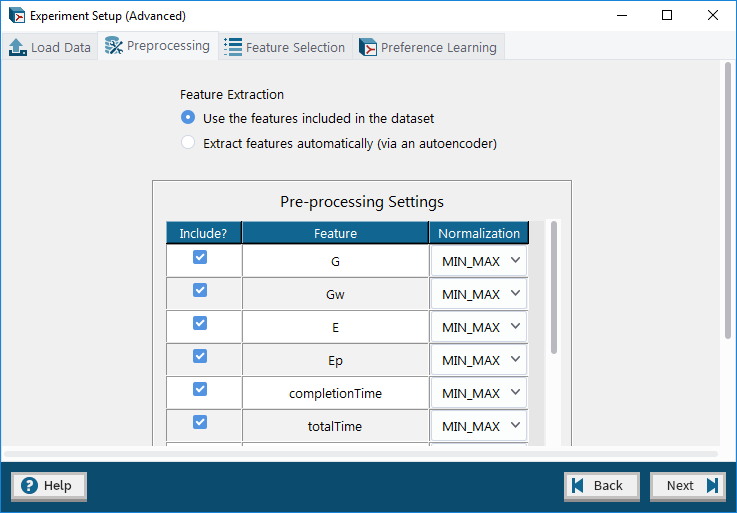
4. Advanced Mode: Data Pre-processing tab – allows user to optionally choose which features to include in the experiment and apply normalization methods to them as well as to automatically extract features from the dataset using an autoencoder.
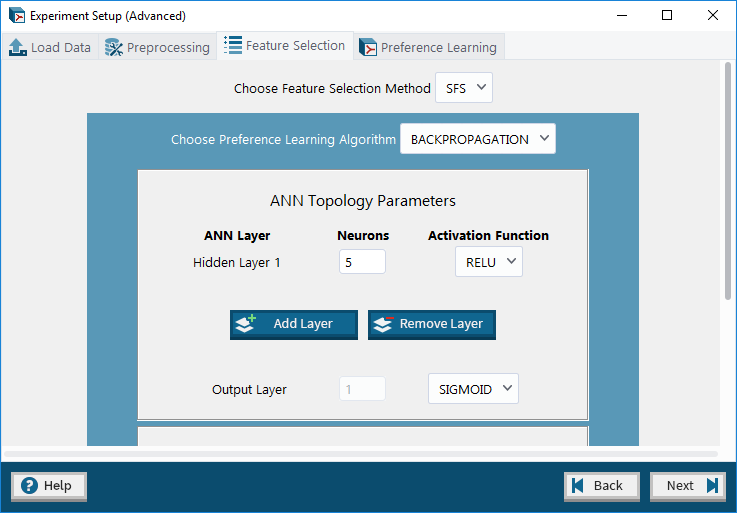
5. Advanced Mode: Feature Selection tab – allows user to optionally choose a feature selection method (and set its parameters) to apply to the dataset.
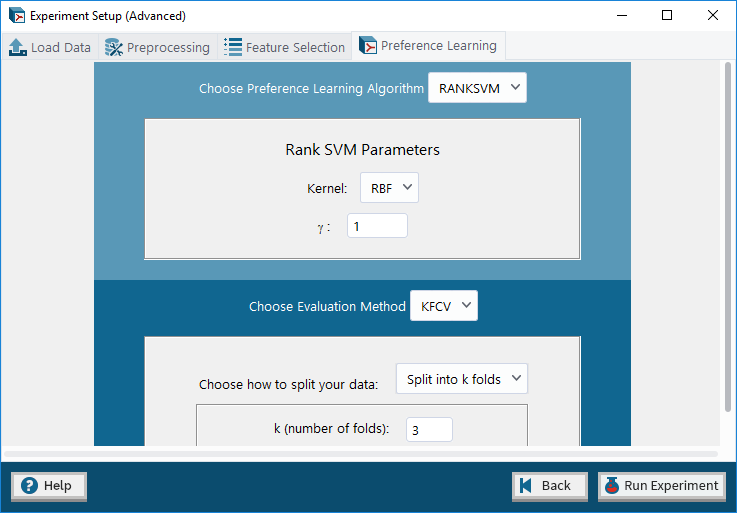
6. Advanced Mode: Preference Learning tab – allows user to select a preference learning algorithm and optionally an evaluation method (and set their parameters) to infer a computational model from the given dataset.
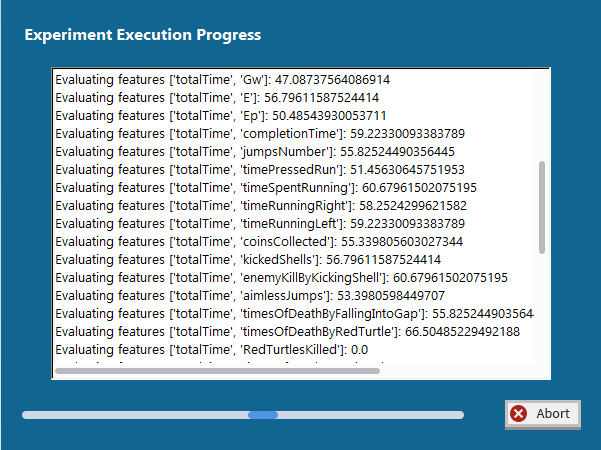
7. Progress Window – a progress bar and log indicating the status of execution of the experiment.
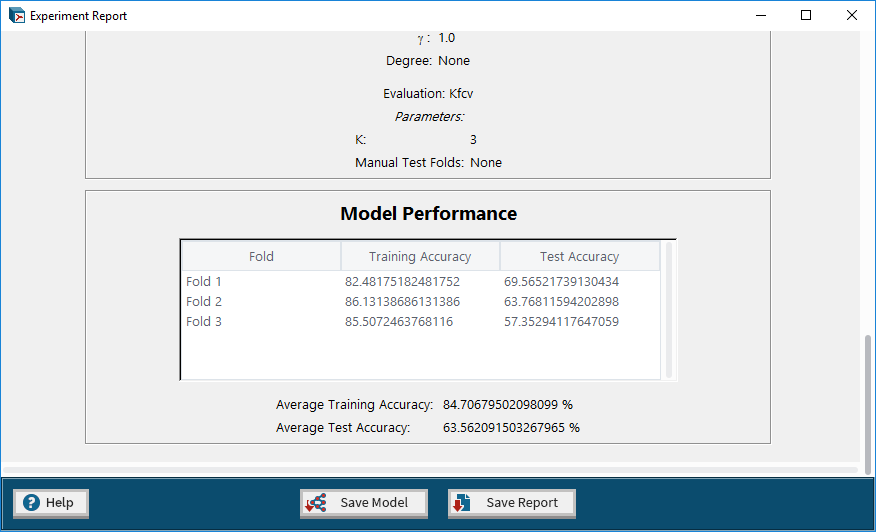
8. Experiment Report – a report containing the details and results of the completed experiment.
Detailed Guidelines
Loading the dataset
A dataset needs to contain two elements: a set of objects (input) and the relation or order among them (output). In PLT, the dataset may be loaded in one of two formats: a single file format for problems where a total order of objects exists and a dual file format for problems where a partial order of objects exists.
A total order of objects is a rating given for each object (see example below).
A partial order is a set of pairwise preferences given for a number of objects in the dataset (see example below).
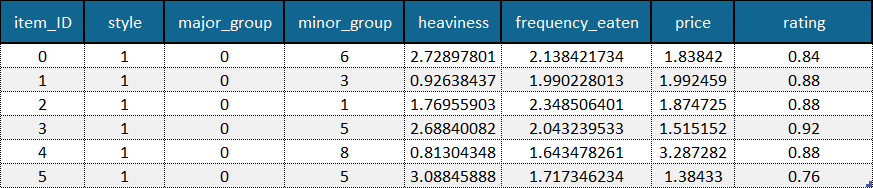
Example of a dataset where a total order in the form of item ratings (last column) is available. Example data is adapted from the Sushi Preference Dataset [1].
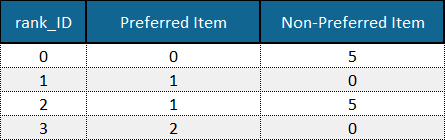
Example of a set of pairwise preferences defining the partial order of items in a dataset. Example data is adapted from the Sushi Preference Dataset [1].
In the single file format, a single Comma-Separated-Value (.csv) file must be uploaded. This file should contain the objects together with their individual ratings. On the other hand, in the dual file format, two Comma-Separated-Value (.csv) files must be uploaded: a file containing the objects and a file containing the pairwise preferences.
Objects
In PLT, all objects in the objects file or single dataset file have to be represented by the same list of features or attributes. Each line/row of the file contains the feature values* of one object separated by a single character (comma by default).
(Optional: the first line/row of the file can contain the name of the features.)
(Optional: the first feature (column) of each object (line/row) can be used as object ID. ID values must be unique integers.)
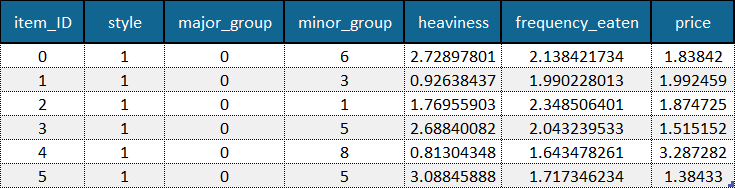
Example of an objects file with feature names (first row) and object IDs (first column) included. Example data is adapted from the Sushi Preference Dataset [1].
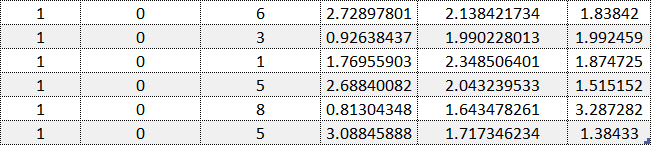
Example of an objects file without feature names or object IDs. Example data is adapted from the Sushi Preference Dataset [1].
*Please note that at the time being, the Python implementation of PLT does not yet support nominal data and therefore only numeric feature values in integer (e.g. 1), floating point (e.g. 0.01) or scientific (e.g 1e-10) format are permitted.
Ratings: total order
When the available order among objects is total (i.e., the relation between any pair of objects is known) and given as a numeric value** assigned to each object, this value can be included as the last feature (column) in the objects file but uploaded as a single data file.
**Only numeric values in integer (e.g. 1), floating point (e.g. 0.01) or scientific (e.g 1e-10) format are permitted.
Pairwise preferences: partial order
When the available order among objects is partial (i.e., only the relation between some pairs of objects is known), this information should be included in a separate order (ranks) file.
Each line/row of the order file contains a pair of object IDs, the first being that of the preferred object in the pair and the second being that of the other (non-preferred) object in the pair. Note that when the objects file does not contain object IDs, the line/row number is used as ID (starting at 0 and excluding the optional labels line/row).
(Optional: the first line/row of the file can contain the name of columns; e.g., ‘PreferredObject’, and ‘NonPreferredObject’.)
(Optional: the first column of each object (line/row) can be used as a rank ID. ID values must be unique integers.)
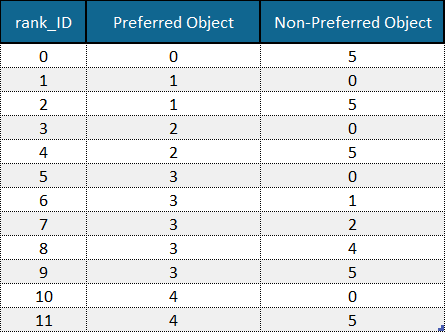
Example of an order (ranks) file with column names (first row) and rank IDs (first column) included. Example data is adapted from the Sushi Preference Dataset [1].
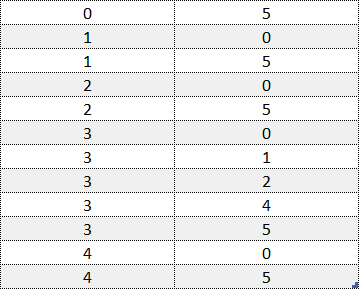
Example of an order (ranks) file without column names or rank IDs. Example data is adapted from the Sushi Preference Dataset [1].
Saving Experiment Logs
Once an experiment has been run, its details and results may be saved to a Comma-Separated Value (CSV) file in a human-readable manner via the ‘Save Report’ button at the bottom of the Experiment Report window.
Saving Models
It is possible to save the computational models inferred from your data via PLT to a Comma-Separated Value (CSV) file via the ‘Save Model’ button at the bottom of the Experiment Report window. The models are saved in a human-readable format.
For RankSVM models, support vectors are stored in the first column and the corresponding alpha values are stored in the second column. In our case, each support vector is in the form of a preference pair (two object IDs separated by a comma in round brackets). The first object ID in the tuple refers to the preferred object in the pair whereas the second refers to the non-preferred object in the pair.
For Artificial Neural Networks models (inferred via the Backpropagation algorithm), the weights of the network are stored as follows:
- The ‘Layer’ column stores the name of the layer (the letter ‘h’ signifies a hidden layer).
- The ‘Neuron’ column stores the index of the neuron in the given layer.
- Columns starting with the letter ‘w’ store the weights of incoming edges to the given neuron (indicated by the ‘Neuron’ column) in the given layer (indicated by the ‘Layer’ column). The number of such columns is based on the largest number of incoming edges present with respect to the neurons in the network. In the case of neurons with less than this amount of incoming edges, the excess column values are empty.
- The ‘bias’ column stores the bias value of the neuron in the given layer.
- The ‘activation_fn’ column stores the name of the activation function used by the given neuron in the given layer.